September Commentary
The 2026 Midterms and the Shifting Investment Landscape
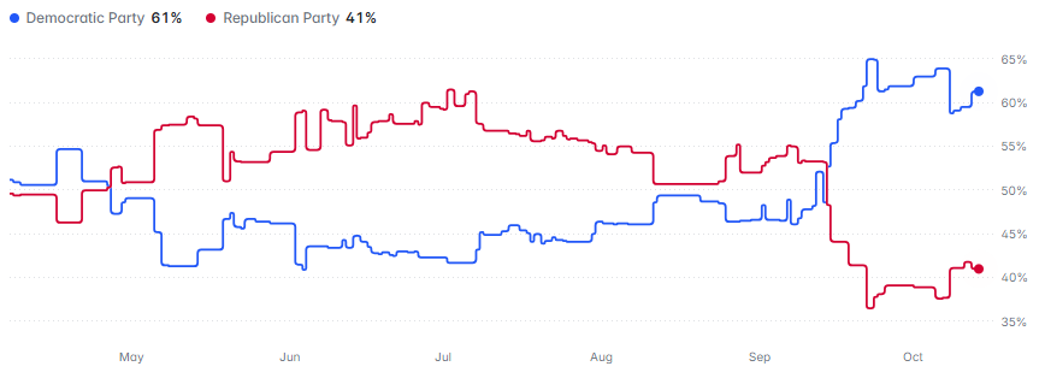
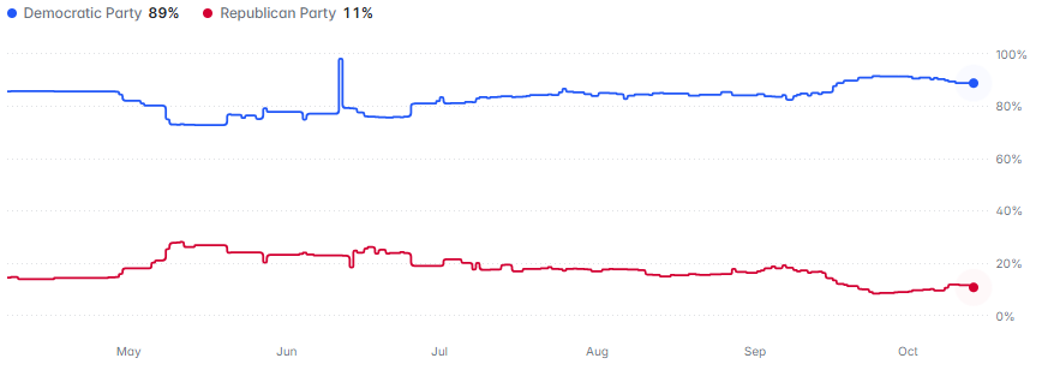
With control of Congress at stake in the 2026 midterm elections, voters will determine whether Republicans retain the majorities that have shaped tax, spending, and regulatory policy or Democrats gain the power to constrain the administration’s agenda. Affordability remains the central issue, as inflation, higher gasoline and diesel prices, housing costs, and pressure on household and farm budgets outweigh the political benefits of solid growth, low unemployment, and resilient markets. Affordability concerns, combined with President Trump’s low approval rating, are pushing the Democrats to potentially outperform. Both polls and prediction markets have the Democrats taking both chambers of Congress, with the implied probability of winning at roughly 89% for the House and 61% for the Senate, pointing to a possible Democratic sweep, although narrow margins and competitive races leave room for uncertainty. History also favors the opposition party: the president’s party has lost seats in 20 of the past 23 midterm elections, averaging about 27 House seats and 3 Senate seats, suggesting that this election could materially reshape Washington even if divided government and the Senate filibuster limit major legislative changes. For reference, the current Senate makeup is 53 Republican, 45 Democrat, and 2 Independent. The House of Representatives’ current composition is 218 Republican, 214 Democrat, 1 Independent, and 2 Vacant.
The Prediction Markets’ Projected U.S. Senate Midterm Winner has Shifted Dramatically since Summer
Source: Polymarket.
Polymarket’s U.S. House Midterm Winner Prediction Remains Solidly Democratic
Source: Polymarket.
The midterms are unlikely to materially change the broader macro or policy direction as most of the key issues, including tariffs, trade, deregulation, immigration, and foreign policy, remain largely under executive control. Instead, the election’s impact is more likely to be felt at the margins through fiscal negotiations and sector-specific policies involving healthcare funding, energy, and financial regulation. Fiscal policy is particularly election-sensitive, including the timing of SNAP (Supplemental Nutrition Assistance Program) and Medicaid cuts, defense spending, government funding, and the debt limit. Even so, the range of outcomes remains relatively narrow.For investors, the makeup and cohesion of the congressional majority may matter more than which party controls Congress.
A key concern for investors is whether AI regulation could slow data center development and the AI capital-spending cycle, one of the most important current drivers of the U.S. economy and stock market. In our view, sweeping federal legislation is unlikely to pass because AI leadership is considered essential to national security and economic competitiveness. The administration views data centers, semiconductor leadership, and frontier-model performance as strategic priorities, particularly as China advances rapidly with ample infrastructure, energy resources, and limited local resistance to construction. Unless a major incident creates bipartisan pressure, broad federal regulation remains unlikely. AI spending should continue under either political party.
The election is more likely to affect where and how facilities are built than the overall level of AI capital spending. States continue to lead efforts to regulate data centers. Although 72% of likely 2026 voters consider candidates’ AI positions important, the main constraints remain state and local power rates, grid connections, zoning, water permits, and tax incentives. In the first six weeks of 2026, more than 300 data center-related bills were introduced across over 30 states, and at least 18 states proposed special rate classes for large energy users. Development should continue, but it will likely become more selective and concentrate in communities that offer practical mitigation and cost-sharing solutions.
Sector Implications Under Different Congressional Scenarios
Republican control, the status quo. If Republicans retain control of Congress after the midterm elections, the result would likely be continued policy stability rather than a major change in direction. The macro agenda would remain focused on lower taxes, immediate expensing, deregulation, faster permitting, domestic energy production, pharmaceutical manufacturing onshoring, and increased defense and infrastructure spending. Trade and tariff policy would also remain central. Narrow congressional majorities could limit the scope of major legislation.
This policy backdrop would be most constructive for technology, industrials, energy, financials, defense, and infrastructure-related companies. Likely beneficiaries include electrical equipment, distributed power, nuclear energy, oilfield services, engineering and construction, building materials, cloud platforms, cybersecurity, strategic materials, regional banks, alternative asset managers, and railroads. A continued emphasis on fossil fuels, pipelines, grid upgrades, and nuclear power would support traditional energy and select utilities, while reduced incentives and added regulatory hurdles could pressure companies with significant wind and solar exposure. In healthcare, Most-Favored-Nation drug pricing should remain in place, tariffs could encourage domestic pharmaceutical production, and pressure on the National Institutes of Health budget could continue.
Democratic Congress. A cohesive Democratic majority in Congress could create greater near-term policy uncertainty but would also have the votes to pursue a broader agenda. Priorities would likely include delaying or reversing reductions to SNAP and Medicaid, restoring Affordable Care Act subsidies, expanding the Inflation Reduction Act’s drug-price negotiation provisions, advancing greater drug-pricing transparency, and increasing NIH funding. Democrats would also be more likely to restore or extend clean-energy tax credits and tighten oversight of companies facing criticism over high profits, consumer prices, or environmental practices. Hospitals, Medicaid-focused managed-care companies, consumer staples, food retailers, and other businesses tied to lower-income consumers would face less downside risk, while renewable utilities and clean-energy suppliers could benefit. Traditional energy producers, by contrast, could face greater regulatory and policy pressure.
A slim or fragile Democratic majority would likely produce a more restrained outcome. Internal divisions and narrow voting margins could limit major legislation, increase the risk of recurring funding and debt-ceiling disputes, and make it harder to enact meaningful changes to Medicaid, SNAP, drug pricing, or clean-energy policy. In that case, sector performance would be driven more by shifting expectations and policy uncertainty than by sweeping legislative change.
Across either scenario, renewable energy would likely receive a more favorable policy backdrop, although the magnitude would depend on how cohesive the majority is. Nuclear energy should remain well positioned because of bipartisan support for dependable, carbon-free power. Utilities could face some additional scrutiny related to data-center expansion, but a major disruption to the build-out appears unlikely.
A divided government would likely result in greater legislative gridlock, increasing the risk of funding and debt-limit standoffs while limiting fiscal expansion, new Treasury supply, and major changes to tax, regulatory, healthcare, climate, or energy policy. The result could be modest downside risk to economic growth but greater policy visibility for businesses, since sweeping legislation would be less likely and the administration would have to rely more heavily on executive actions that a future administration could reverse. That backdrop could benefit large-cap pharmaceutical companies, health IT, smaller biotech firms, select technology companies, defense contractors, hyperscalers, and data-center REITs. Energy companies could face lingering uncertainty around long-term investment decisions, while renewable-energy permitting may become leverage in broader negotiations; however, the sector would likely remain insulated from major legislative overhauls. Financials could face additional regulatory scrutiny, while modestly lower federal borrowing needs could reduce Treasury supply and interest-rate volatility compared with unified government.
A few state ballot measures to watch.- California’s proposed one-time 5% billionaire wealth tax.
- Florida’s expanded homestead exemption.
- Washington’s millionaire tax repeal.
- Proposed tax caps in North Carolina and Oklahoma.
Market Summary
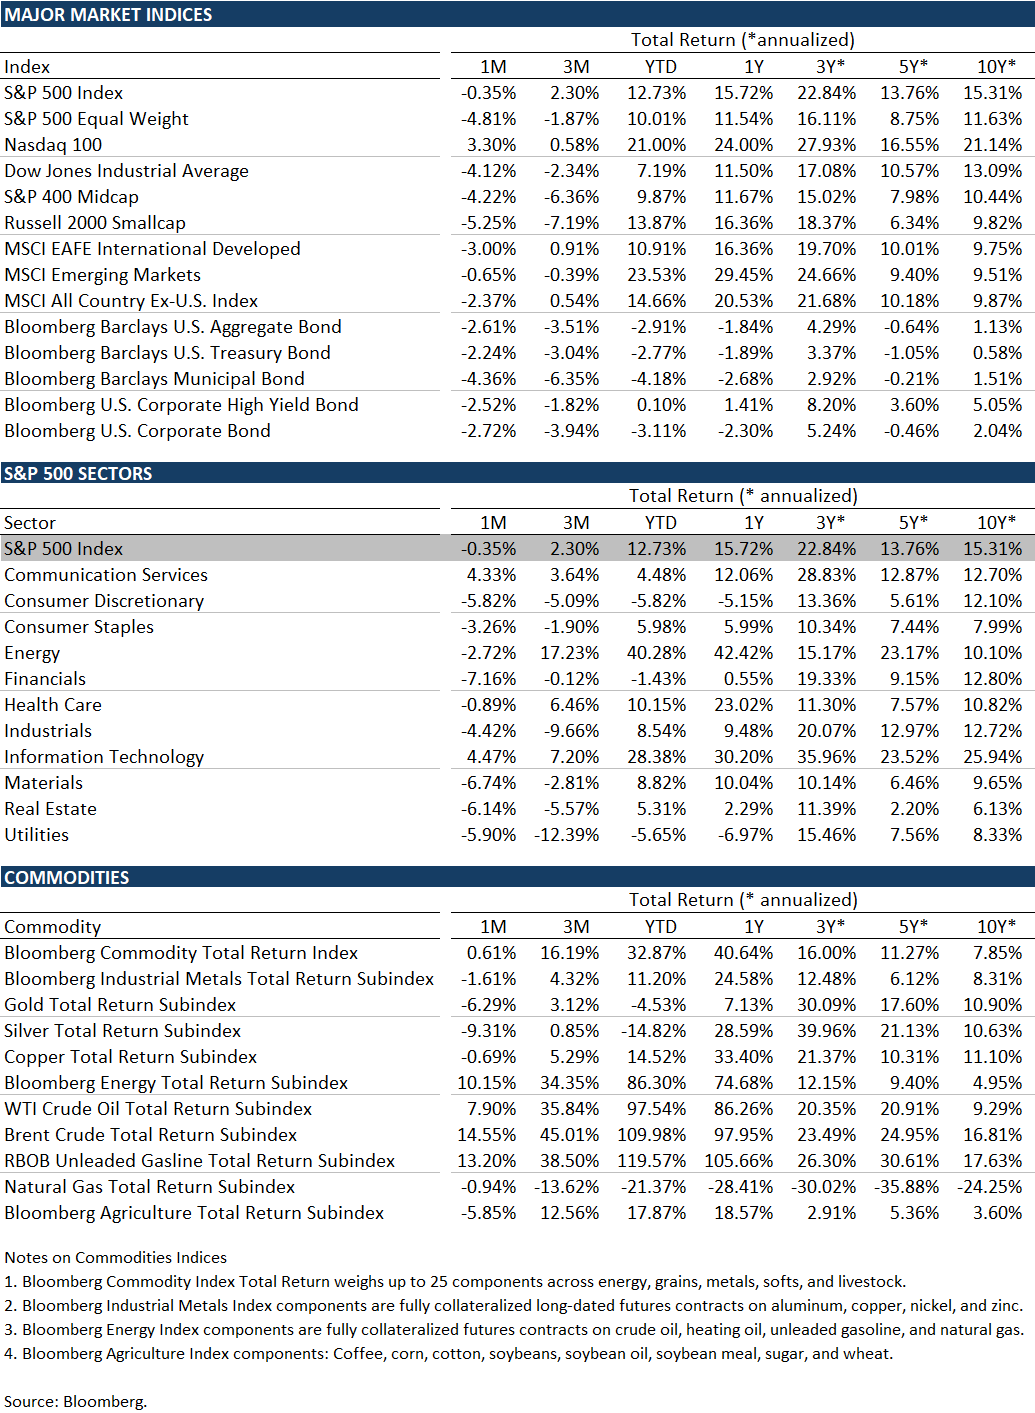
U.S. equities finished September with mixed headline results but broad weakness beneath the surface. The S&P 500 slipped 0.35%, while the Nasdaq Composite gained 1.93% as a narrow group of mega-cap technology and AI-related companies offset declines across most of the market. The equal-weight S&P 500 fell 4.81%, the Dow declined 4.12%, and the Russell 2000 dropped 5.25%, underscoring the sharp divide between large-cap growth leaders and the average stock. Despite the difficult month, the S&P 500 remained up 12.75% year to date.
The month began with resilient economic data and continued enthusiasm for AI infrastructure supporting the largest growth companies, but the backdrop became more challenging as oil prices and Treasury yields moved sharply higher. Rising energy costs, persistent inflation, heavy government and corporate debt issuance, and expectations for tighter monetary policy pushed the 10-year Treasury yield to 5.29%. At its September 15–16 meeting, the Federal Reserve raised the federal funds target range by 25 basis points to 3.75%–4.00%, its first increase since 2023, and signaled that another hike could be needed. These developments pressured rate-sensitive, cyclical, and highly leveraged areas of the market through the middle and latter parts of the month. Stocks found some relief late in the month when softer-than-expected PCE inflation reduced expectations for an immediate follow-up rate increase.
At the company level, strong spending on semiconductors, cloud capacity, data centers, memory, and optical networking reinforced the long-term AI investment story, although concerns about the pace, financing, and potential returns on that spending created sharp dispersion among individual stocks. Large-cap growth was the clear winner: the Russell 1000 Growth Index advanced 2.16%, while the Russell 1000 Value Index declined 3.13%. Information Technology and Communication Services were the only S&P 500 sectors to post gains, rising 4.5% and 4.3%, respectively, as semiconductor, AI infrastructure, and select mega-cap platform companies led. Financials, Materials, and Real Estate were the weakest sectors, falling 7.2%, 6.7%, and 6.1%, respectively, as higher yields, tighter financial conditions, and growth concerns weighed on more economically sensitive businesses. Overall, September showed that solid economic activity, resilient earnings expectations, and sustained AI investment remained positive catalysts, but their benefits were concentrated and not strong enough to offset the broader pressure from oil, inflation, and rising interest rates.
International and emerging market equities generally declined in September as a stronger U.S. dollar, higher global yields, and elevated energy prices weighed on returns. Developed market international equities, as measured by the MSCI EAFE Index, declined 3.00%, while emerging market equities, as measured by the MSCI Emerging Market Index, fell 0.65%. Performance varied widely, with strength in Taiwan, South Korea, and Brazil partially offsetting sharper declines in China, India, South Africa, and Turkey.
Fixed-income markets had very poor September returns. The Bloomberg U.S. Aggregate Bond Index declined 2.61%, municipals fell 4.36%, investment-grade corporates dropped 2.72%, and high-yield bonds lost 2.52%. Municipal weakness was amplified by tax-loss selling and elevated new-issue supply, while record borrowing tied to AI infrastructure added pressure across government and corporate markets.
Yields and the Fed
U.S. Treasury yields moved sharply higher during the quarter as persistent inflation pressures, rising oil and refined-product prices, a resilient economy, heavy Treasury and corporate debt supply, and growing fiscal concerns led investors to expect a more aggressive Federal Reserve. The Fed raised its policy rate by 25 basis points (bp) to 3.75%–4.00%, its first increase since 2023, and signaled that further tightening could be needed, while stronger economic data, weak Treasury auctions, AI-related corporate borrowing, and higher real-rate expectations added to the bond-market selloff. As a result, the 2-year Treasury yield rose 72 bp to 4.89%, the 10-year increased 82 bp to 5.29%, and the 30-year climbed 68 bp to 5.63%, with the two longer maturities reaching their highest levels since the 2000s. Internationally, yields also rose as the European Central Bank and Bank of Japan increased rates, the Bank of England held policy restrictive, and renewed European sovereign concerns added pressure to global bond markets.
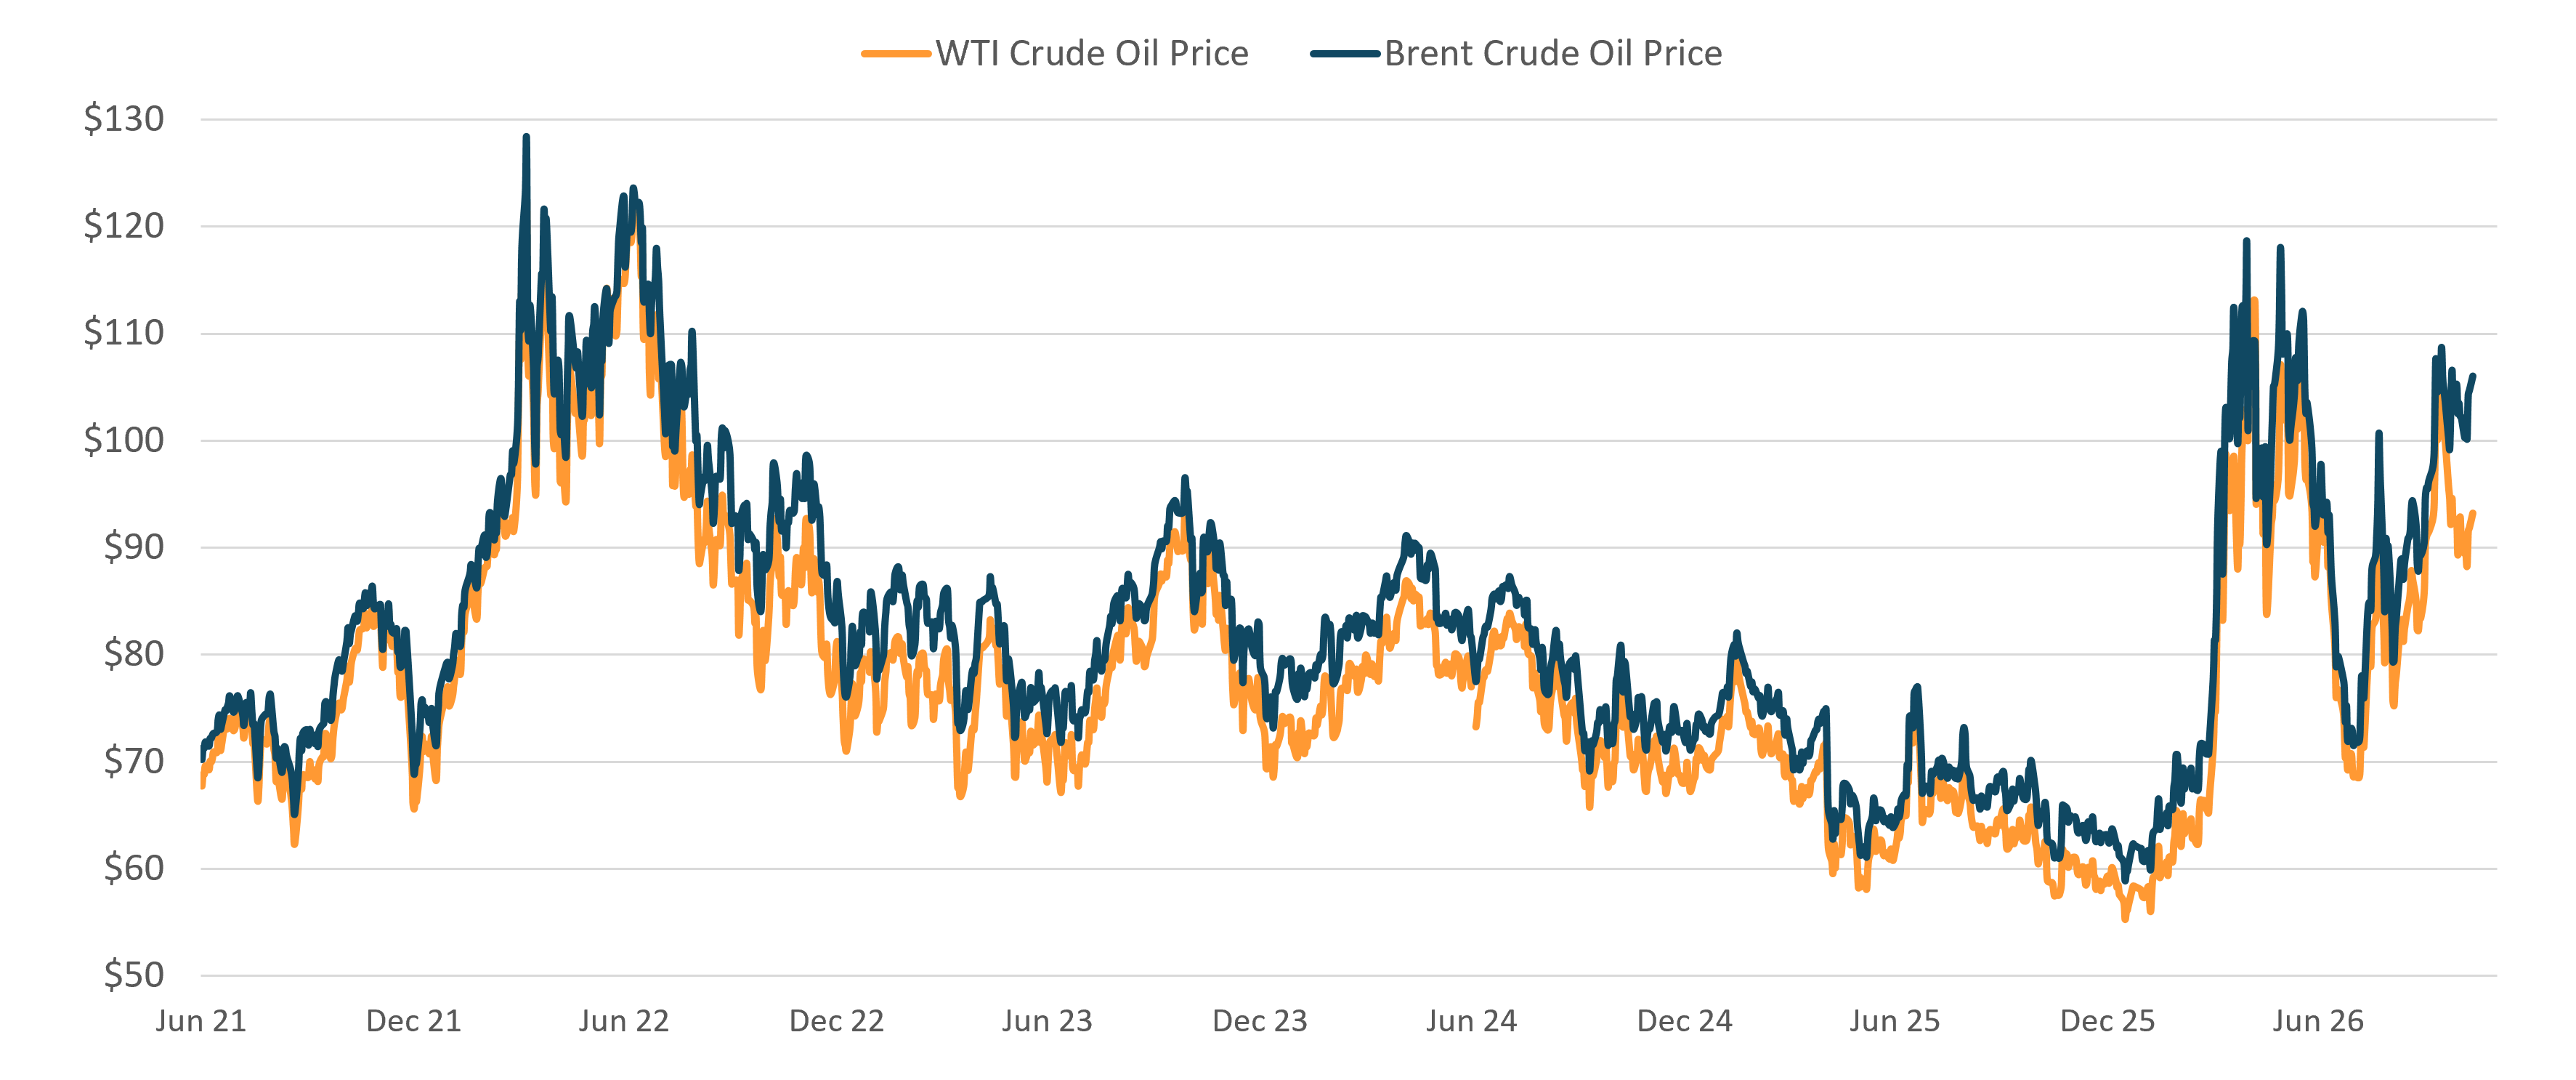
Crude Oil Prices Remain Elevated with Escalated Action in Iran
Source: Bloomberg, First American Bank.
Oil prices were volatile in September as uneven U.S.–Iran peace talks continued, with conciliatory signals alternating with hardline rhetoric and attacks on energy infrastructure and shipping. WTI rose 7.5% for the month to $90.42 per barrel after reaching $100.35 in mid-September, amid attacks that damaged the Saudi East-West pipeline. Brent ended the month at $98.03, up 10.9%, after peaking at $103.31 in mid-September. The average price of unleaded gasoline increased 7.5% to $4.41 per gallon and is now up 48% since the conflict with Iran began. Diesel, a critical transportation fuel, rose 13.5% in September and is now up 70% since the start of the conflict.
Flows through the Strait of Hormuz increased during the month as producers used U.S.-protected shipping lanes along Oman’s coast, supported by ship-to-ship transfers involving numerous large tankers. By month-end, the Saudi East-West pipeline had resumed operations, helping supply. Since month end, G7 nations agreed to release 100 million barrels of crude oil and diesel from emergency reserves over the next four months. Although the G7 has not disclosed the crude-diesel split, the release begins immediately and includes a front-loaded diesel rollout over the first 20 days. Additional refined-product supply, especially diesel, should provide only modest relief; a sustained decline in refined product prices will require refining capacity in the Middle East, Russia, and China to return to pre-war levels, which is unlikely to happen quickly.
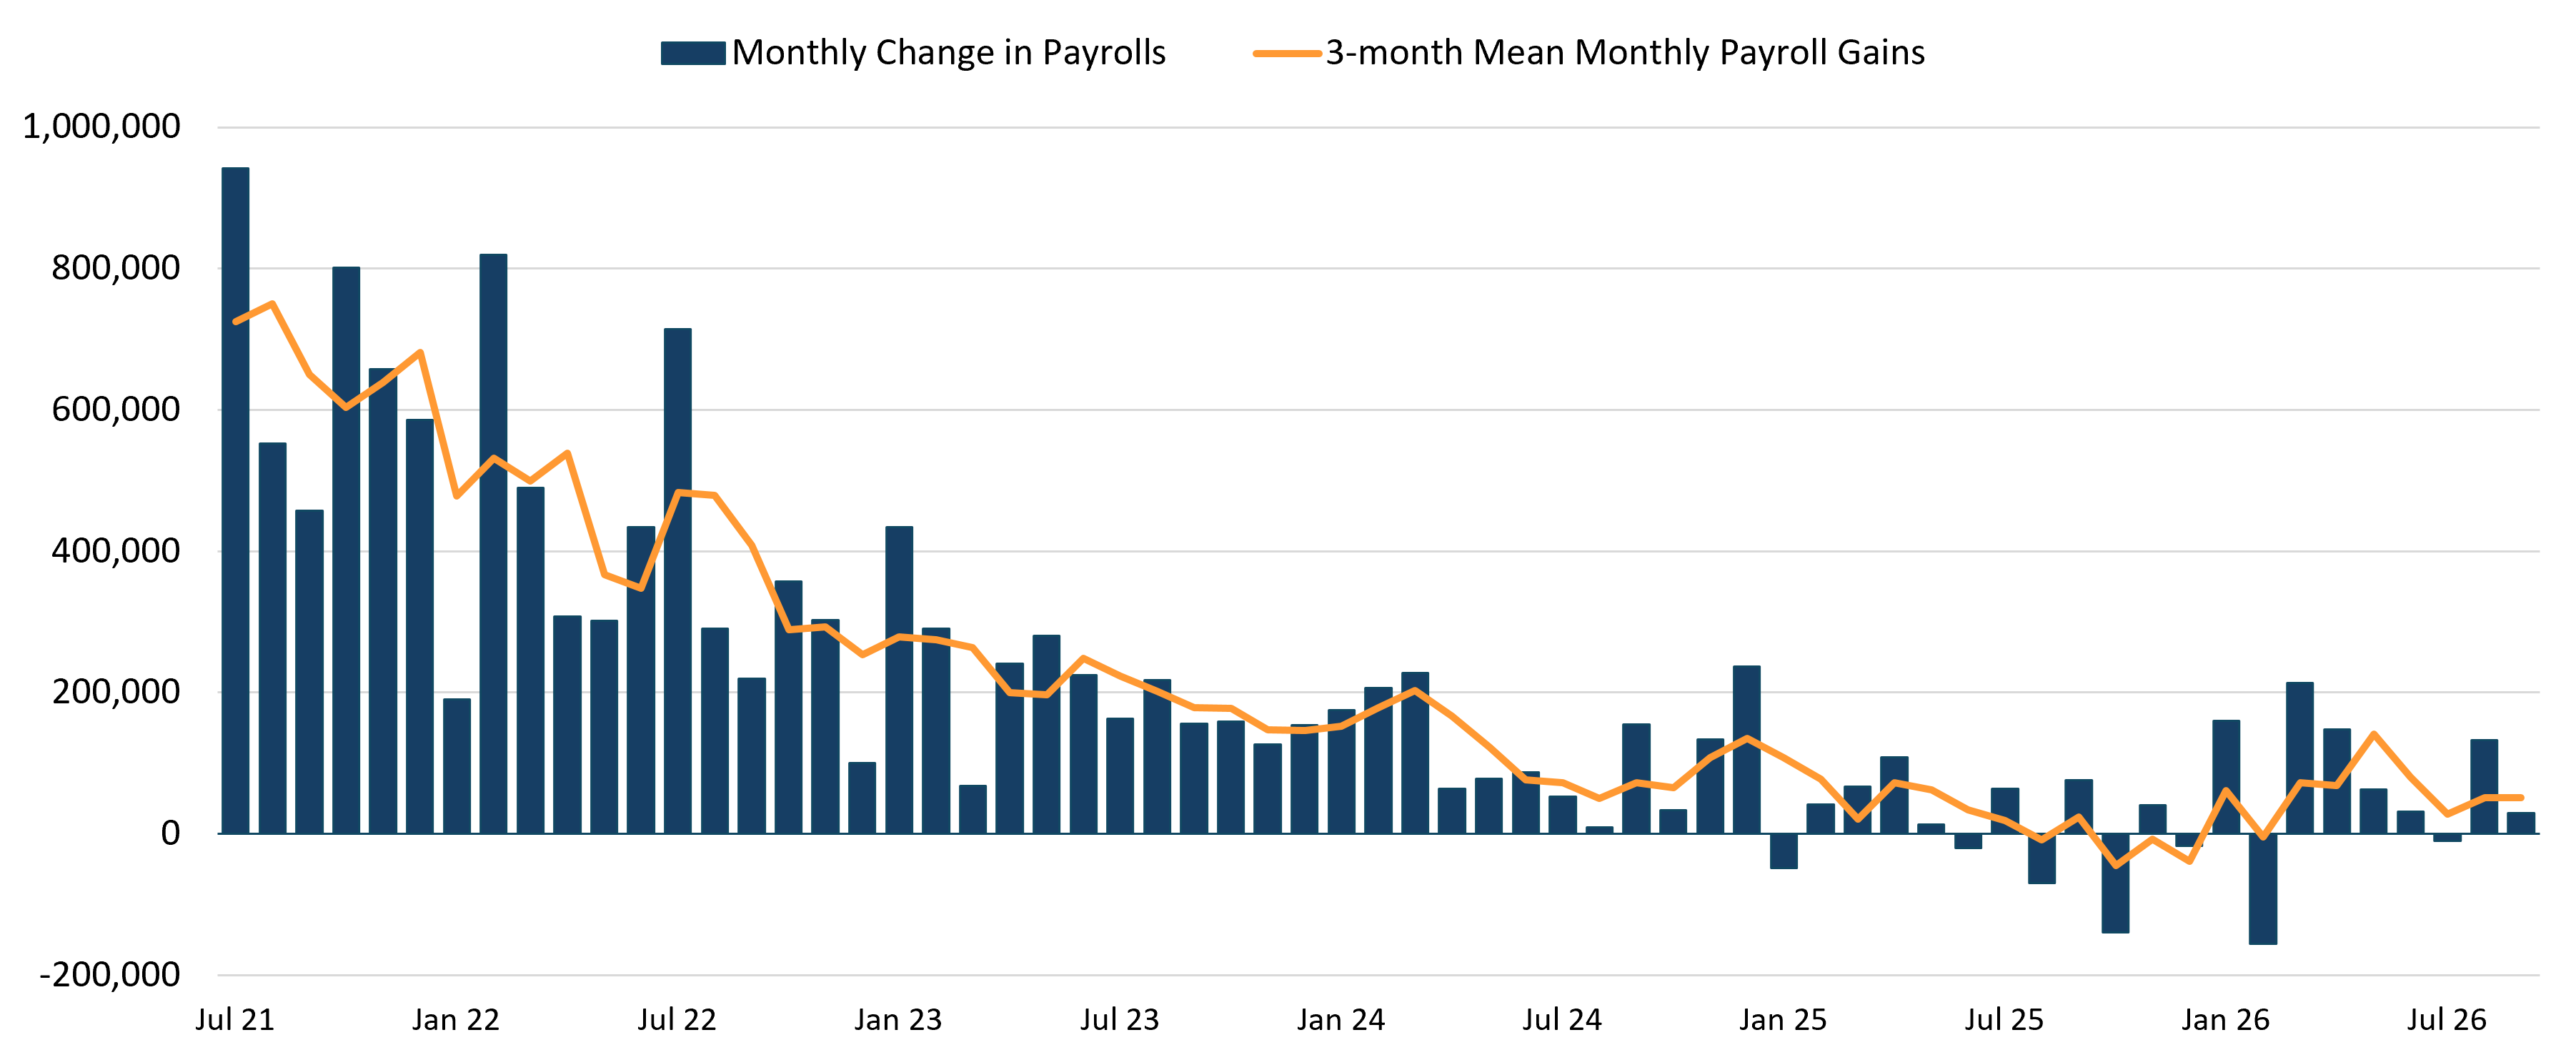
September Non-Farm Payrolls Increased Only Modestly Following the August Bounce
Source: Bloomberg, First American Bank.
After rebounding in August, the U.S. labor market returned to the slow-growth pace seen in late spring and early summer, adding just 29,000 jobs in September versus expectations of 80,000 to 90,000. Under the hood, private payrolls expanded by 46,000, while the public sector shed 17,000 jobs. Prior momentum was also curbed as July payrolls were revised down by 31,000 to -10,000 and August payrolls were trimmed by 29,000 to 133,000, largely because of typical summer volatility in leisure and hospitality. Job gains were concentrated in healthcare (+23,000), construction (+11,000), and durable goods manufacturing (+8,000), with the latter two likely supported by AI-related capital spending and manufacturing incentives. The three-month average and estimated underlying pace of job growth both stand near 51,000, roughly the breakeven rate.
Meanwhile, the unemployment rate edged up from 4.1% to 4.2%, driven by an expanding labor force rather than an uptick in layoffs. In fact, announced job cuts were the lowest for any September since 2022 and were down about 40% year to date from 2025. This expanding labor supply arrived alongside moderating wage growth, as average hourly earnings rose just 0.13% in September and 3.02% from a year earlier.
Summary and Outlook
Our outlook remains constructive. Economic growth is supported by a generational capital-spending cycle, resilient consumer demand, and a steady labor market, while surging corporate earnings are helping offset valuation pressure from higher rates. Historically, markets have often been flat in the months leading up to midterm elections before strengthening afterward. Since 1950, the S&P 500 has risen in the 12 months following all 19 midterm elections, with an average gain of roughly 15%. Divided governments produced modestly stronger results than unified control. We should note, however, that since the start of this presidential cycle the S&P 500 has experienced stronger than average returns, increasing roughly 63%.
However, the path higher is growing less certain and unlikely to be smooth. The Iran and Russian conflicts have introduced supply-side risk through higher prices on oil and refined products, transportation, and other input costs. Elevated crude prices could keep inflation expectations and Treasury yields high, squeeze corporate margins, and limit the Federal Reserve’s flexibility. Households have continued to spend despite weak sentiment and higher prices, but that resilience increasingly depends on continued real income growth, credit, and savings. More expensive energy, elevated financing costs for homes and autos, and wages that fail to fully keep pace with living expenses could eventually force consumers to pull back.
The S&P 500 has returned 12.73% year to date, while earnings estimates have risen 32%, compressing the index’s next-12-month P/E from 22.1x at the start of the year to 18.9x today. The market’s gains have therefore been driven entirely by faster earnings growth than the market has generated in more than four decades (excluding post-recession recoveries). Higher rates and tighter financial conditions appear partly reflected in the index’s lower valuation and more fully priced into certain stocks and sectors. Since the start of the U.S.-Iran war on February 28, 2026, the 10-year Treasury yield has risen 134 bp, from 3.945% to 5.289%, while the S&P 500 has gained 11.98%. Technology accounted for most of that advance, rising 35.86% as the only sector to outperform the index, supported by exceptional AI-driven revenue and earnings growth. The broader market faced a more difficult environment, particularly in rate-sensitive sectors. Consumer Discretionary declined 2.14%, Real Estate fell 2.77%, Materials dropped 7.64%, Consumer Staples slid 8.84%, and Utilities declined 15.65%. Although concerns are increasing, we believe some of the pressure is already priced in, potentially creating attractive opportunities beyond companies specifically involved in AI. For those opportunities to emerge, however, interest rates may need to remain stable or decline. We remain optimistic that strong earnings growth will continue into next year and support further stock-market gains. For bond investors, current yields offer attractive income opportunities not seen in a number of years.
Stay Invested
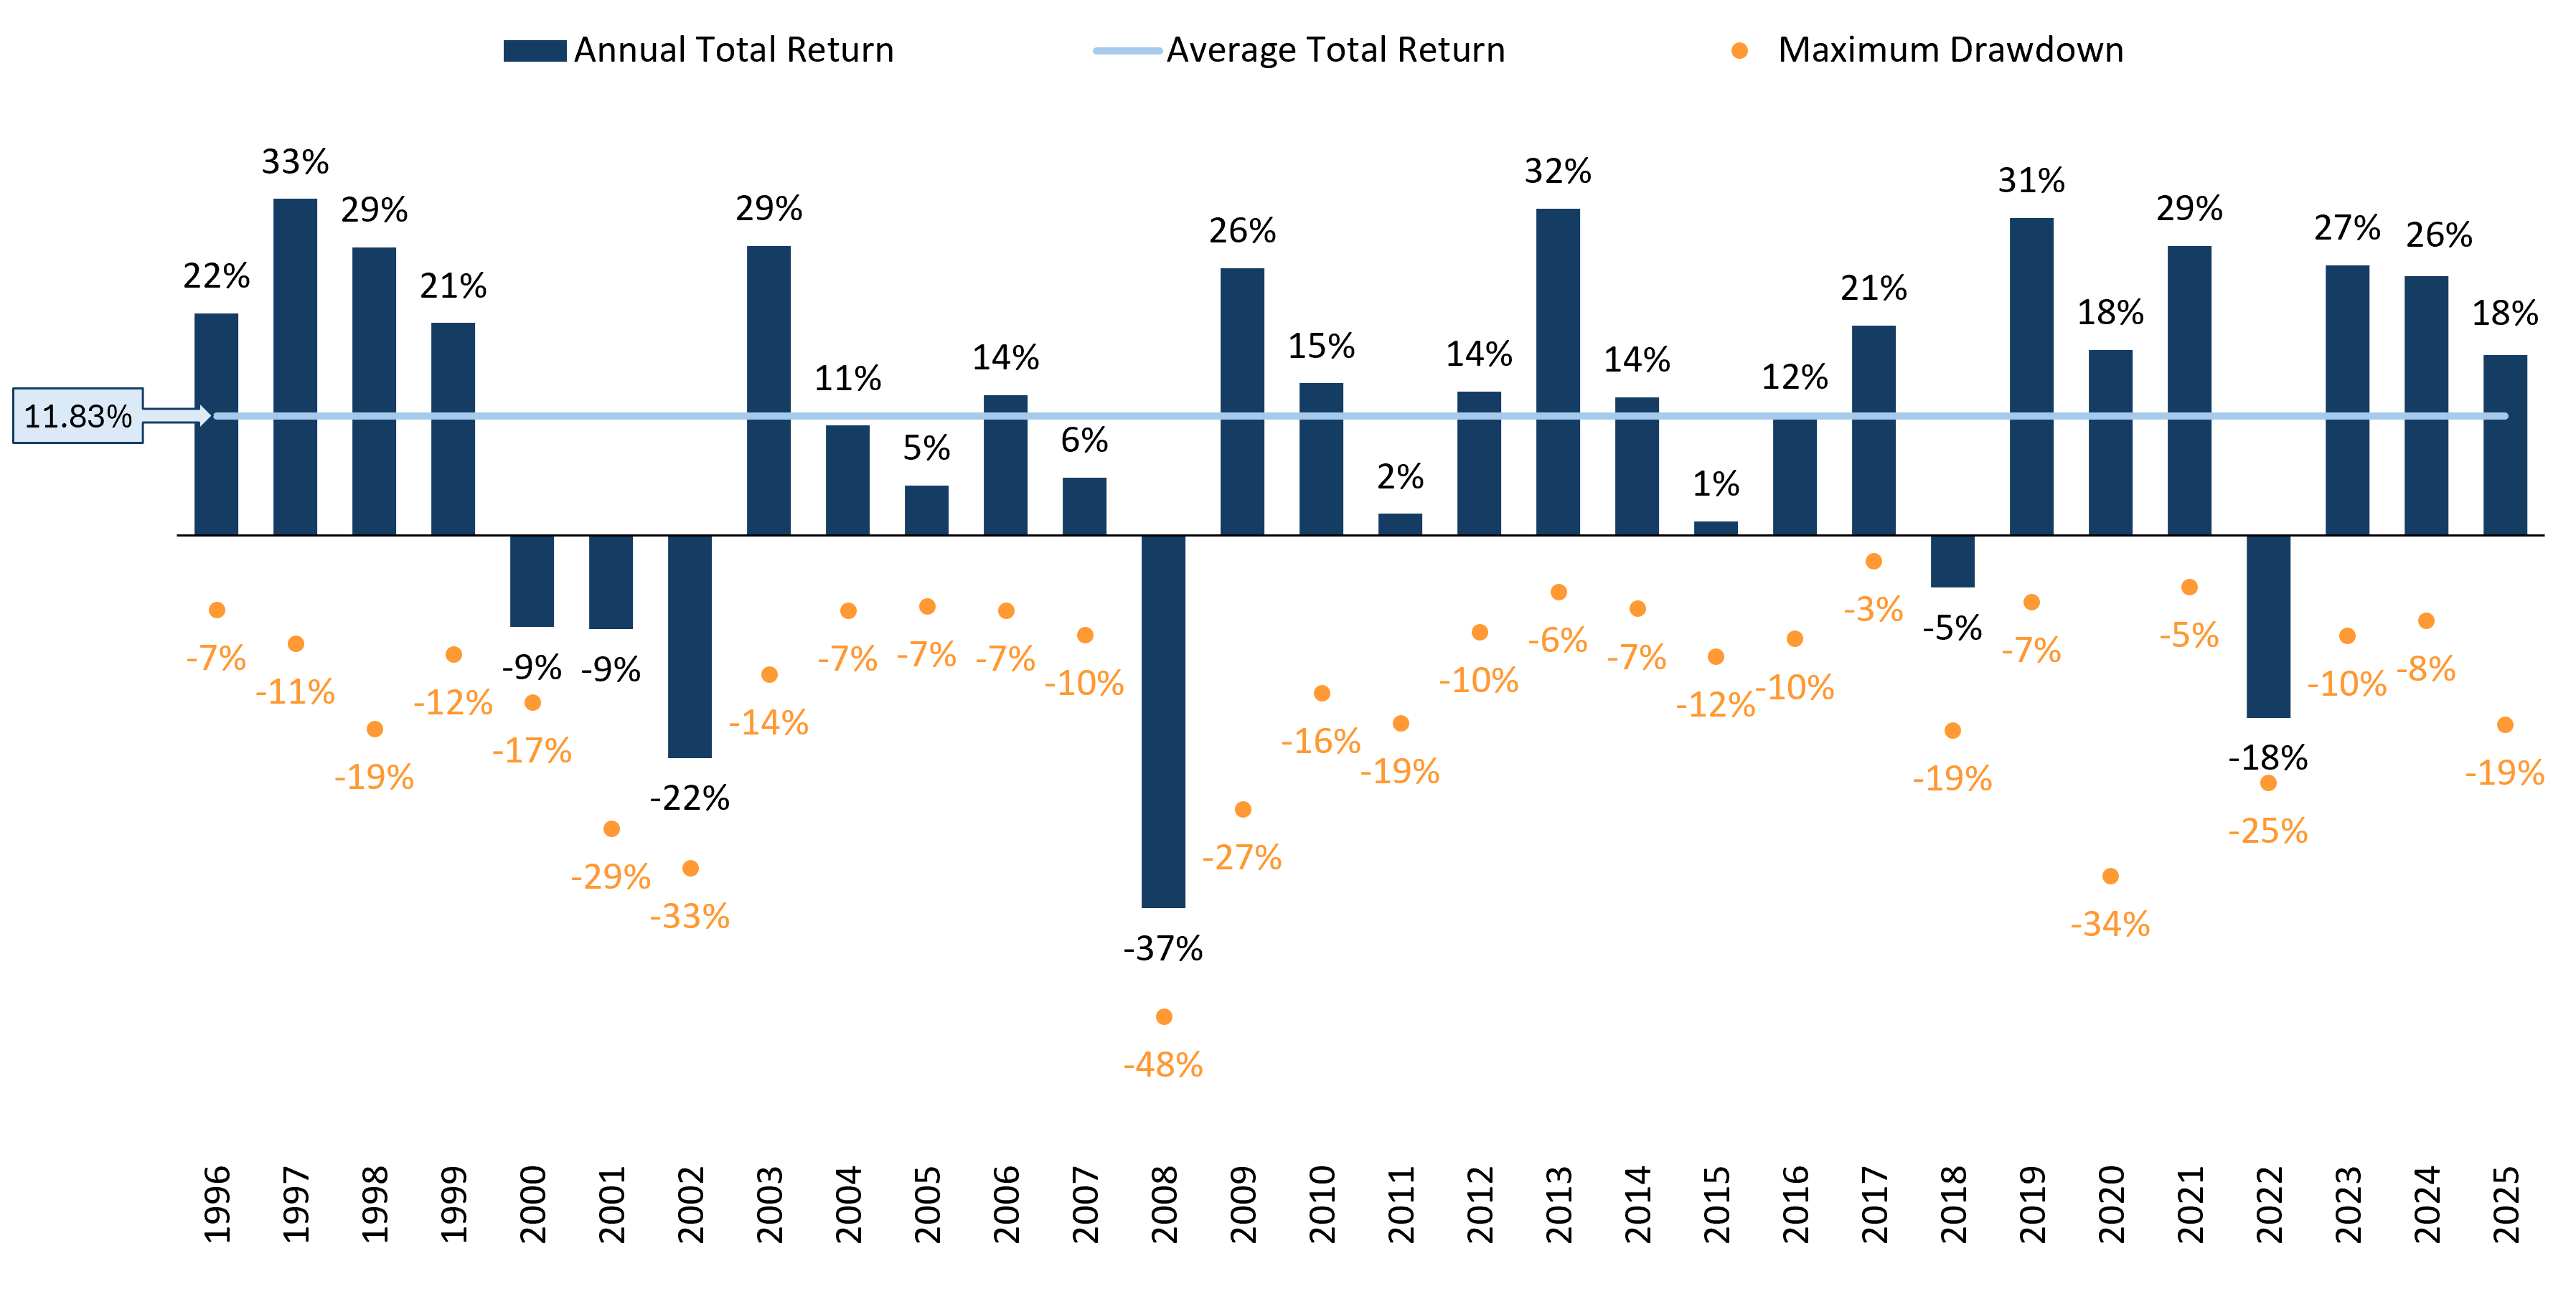
The 30-year Mean Annual Return of the S&P 500 is 11.8%, Despite 15.2% Average Annual Max Drawdown
Source: Bloomberg, First American Bank.